GA4 could be underreporting average engagement time by up to 80%, as compared to Plausible
Imagine logging into Google Analytics. You want to see how your page from last month is performing – how much time does a visitor spend on average on your page. It’s 10 seconds. You end up spending marketing resources, you make strategies for improving your site’s engagement time.
But what if I told you the metric wasn’t as accurate to begin with? It could be underreporting by as much as 80%?
We recently did an experiment to compare the average time spent per page per visitor––in Google Analytics vs Plausible Analytics and found some sizeable differences.
- What is time on page or average engagement time?
- The experiment
- Why the differences?
- Test the difference
What is time on page or average engagement time?
Time on Page or average engagement time is one of the most important engagement metrics for site owners, that helps understand the average time your visitors spend on each page in a specific time period.
Time on page = total active time spent on a page / total unique visitors
This further helps with understanding which pages are most popular in terms of engagement, and the least.
If you’re using Plausible, you would see “time on page”. If you’re using Google Analytics 4, you would see “average engagement time per active user,” Both of these use the same formula as above, and just use different labels.
You could even look at “average engagement time per session” in GA4 if you want to judge average time on page per visit, instead of visitors.
The experiment
We installed both the Google Analytics and Plausible Analytics tracking scripts on a food recipes website. Then compared the data for Mar 12 - Apr 8 2025 (a period of 28 days).
We refer to the same metric as Time on Page in Plausible, whereas it’s referred to as “Average engagement time per active user” in Google Analytics 4.
Here’s the screenshot from GA4’s “Pages and Screens” report:

And here’s Plausible’s Top Pages tab:

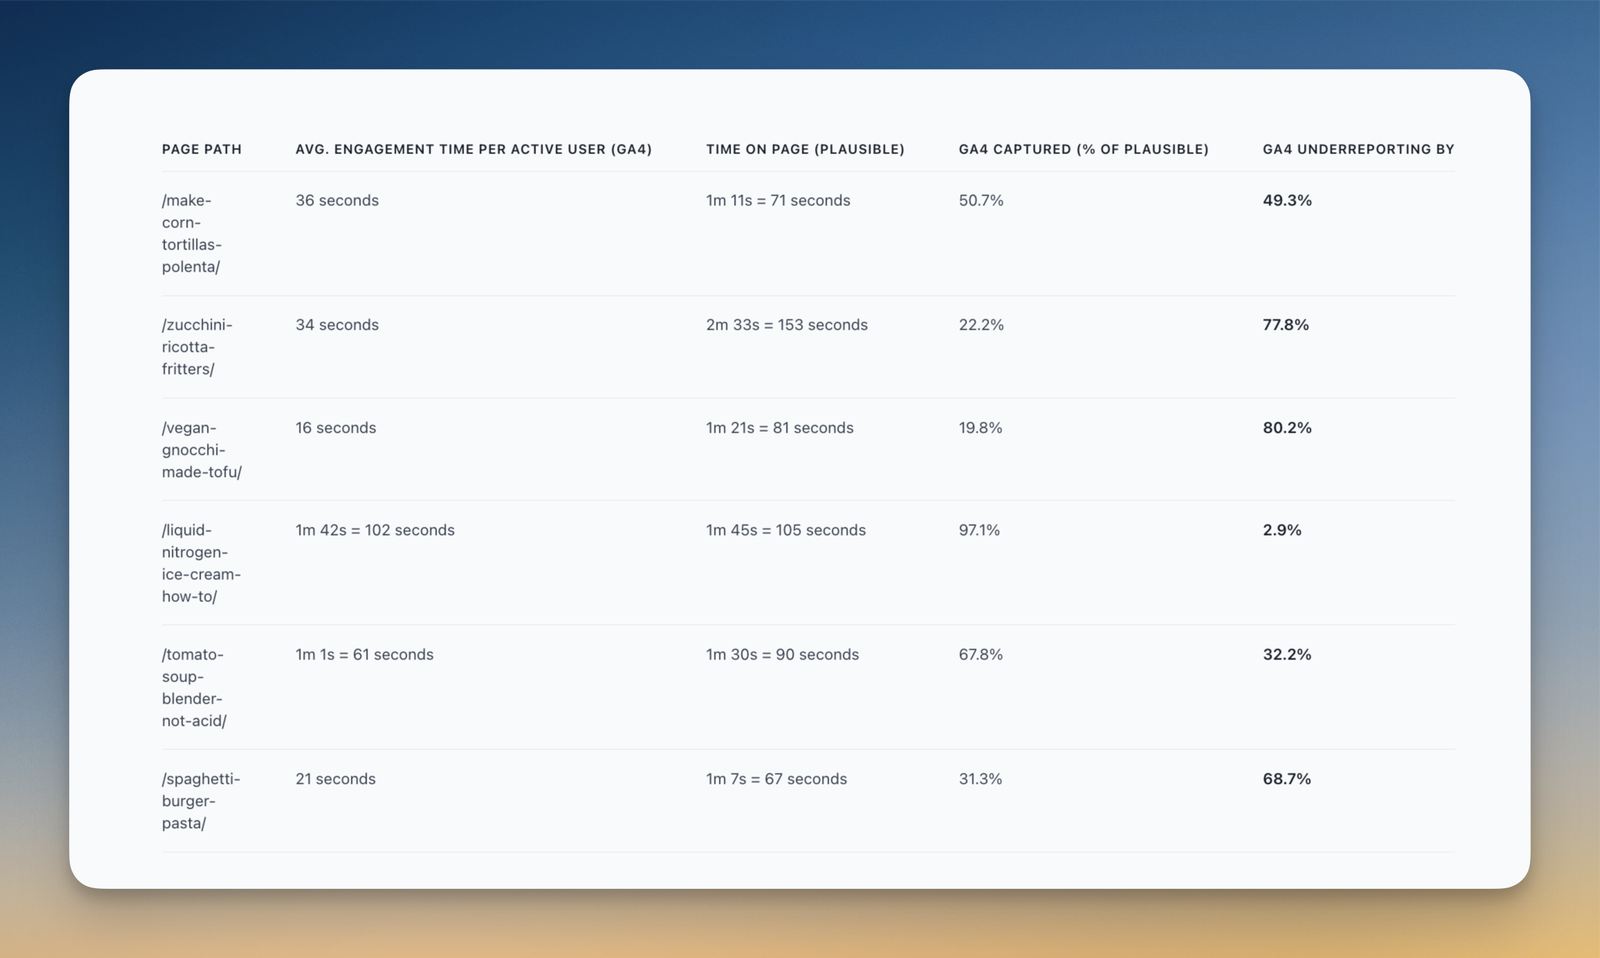
Let’s compare some pages. TOP=Time on Page.
| Page path | TOP (GA4) | TOP (Plausible) | GA4 captured (% of Plausible) | GA4 underreported by |
|---|---|---|---|---|
| /make-corn-tortillas-polenta/ | 36s | 1m 11s = 71s | 50.7% | 49.3% |
| /zucchini-ricotta-fritters/ | 34s | 2m 33s = 153s | 22.2% | 77.8% |
| /vegan-gnocchi-made-tofu/ | 16s | 1m 21s = 81s | 19.8% | 80.2% |
| /liquid-nitrogen-ice-cream-how-to/ | 102s | 1m 45s = 105s | 97.1% | 2.9% |
| /tomato-soup-blender-not-acid/ | 61s | 1m 30s = 90s | 67.8% | 32.2% |
| /spaghetti-burger-pasta/ | 21s | 1m 7s = 67s | 31.3% | 68.7% |
| /coconut-tapioca-pudding-with-mango-sauce/ | 51s | 2m 6s = 126s | 40.5% | 59.5% |
| /spanish-tortilla-potatoes/ | 42s | 2m 8s = 128s | 32.8% | 67.2% |
As you can see, GA4 underreports by as much as 80% as compared to Plausible, while the average underreporting turns out to be 54.7%.
Aka, more than half of the actual user engagement time is missing from Google Analytics 4’s reports, at least as compared to Plausible — which can seriously distort content performance insights and mislead decisions based on time-on-page metrics.
Get clearer engagement metrics without GA4 complexity
What could be going on here? Why are we betting more on Plausible’s engagement time tracking method and benchmarking that against Google Analytics? Where do these differences stem from?
Why the differences?
There are two major reasons we found which are related to how engaged time is logged in Google Analytics, and how the final calculation of average time on page works.
How is engaged time logged in Google Analytics?
Google Analytics 4 considers a session (official src) as “engaged” onlyif the visitor:
- spends at least 10 seconds actively on the site (by default), or
- if they trigger a conversion event (a designated key event), or
- if they view 1+ pages during the session.
This means that if a visitor does not view a second page during their session or doesn’t convert, and leaves before 10 seconds are completed, that chunk of visits is basically absent from all the related metrics in GA4 like the total/aggregated time on page or “user engagement,” number of engaged sessions, and eventually the average engagement time.
Not including sub-10 second visits seems fair at first, especially if you’re only interested in understanding highly engaged visits, but it compounds when final average engagement times are calculated for hundreds of visitors, distorting it by a sizable difference as we saw with our experiment above.
But are non-engaged sessions (sub-10 second visits) really that much? Well yes. Look at the screenshot below.

It’s the same particulars (page paths) for the same time period, but I custom-added four metrics: user engagement, engaged sessions, sessions and average engagement time per session.
Let’s focus on the second row: /make-corn-tortillas-polenta/
Total sessions: 209
Engaged sessions: 103
Non-engaged sessions: 209-103 = 106
i.e., 106 sessions were considered to have an engagement time of zero as per GA4’s rules and were excluded in the calculation of user engagement, engaged sessions, average engagement time, etc.
‼️106 out of 209 sessions were considered non-engaged. That is half of the sessions! That’s one major cause of difference.
How is the average time on page calculated?
Here, it gets more interesting, thanks to my colleague for noticing it. Look at “Average engagement time per session” for once. If you notice closely, it’s 29 seconds for the same second row example.
If the average time on page was calculated against engaged sessions only, we would be getting the following:
(103) mins / (103) engaged sessions = 1 minute
But it’s 29 seconds. Is GA4 dividing total user engagement time by total sessions (and not engaged sessions) instead? That’d be:
103/209 = 0.49 mins = 29 seconds
Bingo!
Turns out, GA4 is anyway dividing engagement time by all sessions, which includes non-engaged visitors, when giving a final calculation of “Average engagement time per session” and most likely, “Average engagement time per active user”.
Concluding the two reasons above: exclusion of sub-10 seconds sessions and still including total no. of sessions in calculating the final average value of time spent on page distorts the final average value by manifolds.
Huh! It took me two days and unlimited patience to sit through various engagement metrics in GA4 and understand the differences and calculation method. And that’s precisely the problem: A typical user won’t be doing that.
You would be seeing the average engagement metrics in isolation, thinking to yourself, “hah! That is my average time on page” and move on.
It could lead to inaccurate insights. Imagine analyzing social media traffic, which typically has higher bounces rates or short visits. It’d be very difficult to measure the performance of your content or design for pages that need improvement.
Time on page tracking in Plausible
If you’re interested in understanding actual time spent on page, it’s necessary to stick to real world scenarios as much as possible. Here’s how we calculate time on page on the sites using Plausible:
- We track active engagement only when the page is in “focus”. So we don’t count the time a visitor spent away from your website, say by switching tabs or switching apps.
- We include time on page for bounced visits (i.e. visits where only a single page was viewed).
- We count all time spent, even very short visits—down to a single second. This is the major difference in calculating time on page in Plausible from GA4.
And so we are confident about the accuracy. Speaking of which, since unique visitors is a part of calculating average time on a page, it’s important to address the differences in calculating that as well.
Calculation of unique visitors
If you compare the two screenshots of GA4 and Plausible, you would see more unique visitors in Plausible as compared to the active users (in our example website’s case, active users are equal to total users) in GA4. We see this all the time due to different calculation methods.
This is another reason that explains the differences in average time on page between the two tools. So the only question remains, which one is more accurate?
Due to our privacy-respecting nature, Plausible counts unique visitors differently than GA4. We delete old salts every 24 hours to avoid the possibility of linking visitor information from one day to the next. This makes us inherently GDPR compliant too.
On the other hand, GA4 counts unique visitors by using a combination of browser cookies (client ID), user IDs (if available), and device IDs (or app instance ID) to identify and track individual users across sessions and devices through multiple days.
But, when it comes to accuracy in counting unique visitors in the first place, many reasons come into play.
- Many visitors never get tracked in GA4 in the first place due to consistent cookie banner declines. Here’s an interesting independent study that showed how every number in GA4 can be misleading due to this very reason.
- GA4 is infamous for nosy tracking and that has led many ad-blockers to prevent the GA tracking scripts from loading. Today, 31.5% of internet users worldwide report using an ad blocker. Same goes for privacy-friendly browsers.
- 58% of Hacker News, Reddit and tech-savvy audiences block Google Analytics. Read study.
So it’s fair to conclude that while GA4 can technically remember a unique visitor for multiple days, it’s actually blocked by multiple privacy-conscious folks for that very reason.
Whereas, Plausible is able to account for all the above cases and bring good accuracy in counting unique visitors without invading their privacy. In a nutshell:
- You don’t need to put up a cookie consent banner when using Plausible, at least from our side. We are GDPR, CCPA, etc., compliant out-of-the-box.
- We are significantly less blocked by privacy-friendly ad blockers and browsers.
- Tech-savvy audiences love Plausible and we haven’t had any reports of such users blocking our script.
Also,
- We use cookieless tracking, whereas GA4 stores cookies on your browser/device which many users delete, or return through a private browser, preventing it from recognizing the same unique visitor.
- We block spam and bot data by default. GA4 users constantly battle with skewing data due to this reason. For eg. When a site uses a cookie management platform (CMP), the CMP might send data center traffic which GA4 is unable to detect and exclude from stats.
- Our data is always fresh and constantly updated. We provide real-time analytics whereas GA4 can take up to 48 hours to fully process data and update your reports.
…etc. There’s a full post on our accuracy practices that ensure we can align your stats with real-world data as much as possible.
Lastly, for the purposes of understanding average time spent on a page, it doesn’t matter which visitor spent how much time, what matters is that there was a visitor and they spent some time.
Test the difference
We invite you to conduct your own tests. We encourage you to install the Plausible script side-by-side your GA4 tracking script and see the differences for your site on your own.
Plausible is absolutely free to use for the first 30 days. If you find any differences, don’t forget to share them with us. :)