Plausible keeps its dashboard intentionally simple. But some workflows need more: custom layouts for clients, reports that blend analytics with ad spend or revenue data or views that go beyond what any fixed dashboard can offer. The official Plausible Data Studio connector is built for those cases.
Google Data Studio, formerly called Looker Studio, is Google’s free data visualization tool. Connect it to Plausible and you can build a report around your data, your layout and your audience.
The Data Studio connector is available on the Business plan.
- Why a Data Studio connector?
- What you can do with it
- What’s available in the connector
- Getting started
- Works alongside the other official integrations
Why a Data Studio connector?
The standard objection to privacy-first analytics is “but it doesn’t let me build custom reports.” The Plausible Data Studio connector removes that objection entirely.
You keep everything that makes Plausible different: no cookies and no collection of personal data about website visitors. You also get the flexibility to present that data for a stakeholder, client or leadership team.
The connector is built and maintained by Plausible and connects through our Stats API.
What you can do with it
Custom reports for clients. Build branded dashboards with only the metrics that matter to each client. Swap your logo in, leave out what’s irrelevant, export as a PDF or share a live link.
Blend Plausible with other data sources. Data Studio can combine data from multiple sources in the same report. Bring in Google Ads spend, Meta campaign data, or a Google Sheet with revenue targets alongside your Plausible traffic data. Calculate cost-per-visitor, compare traffic against targets, or track campaign ROI in one view.
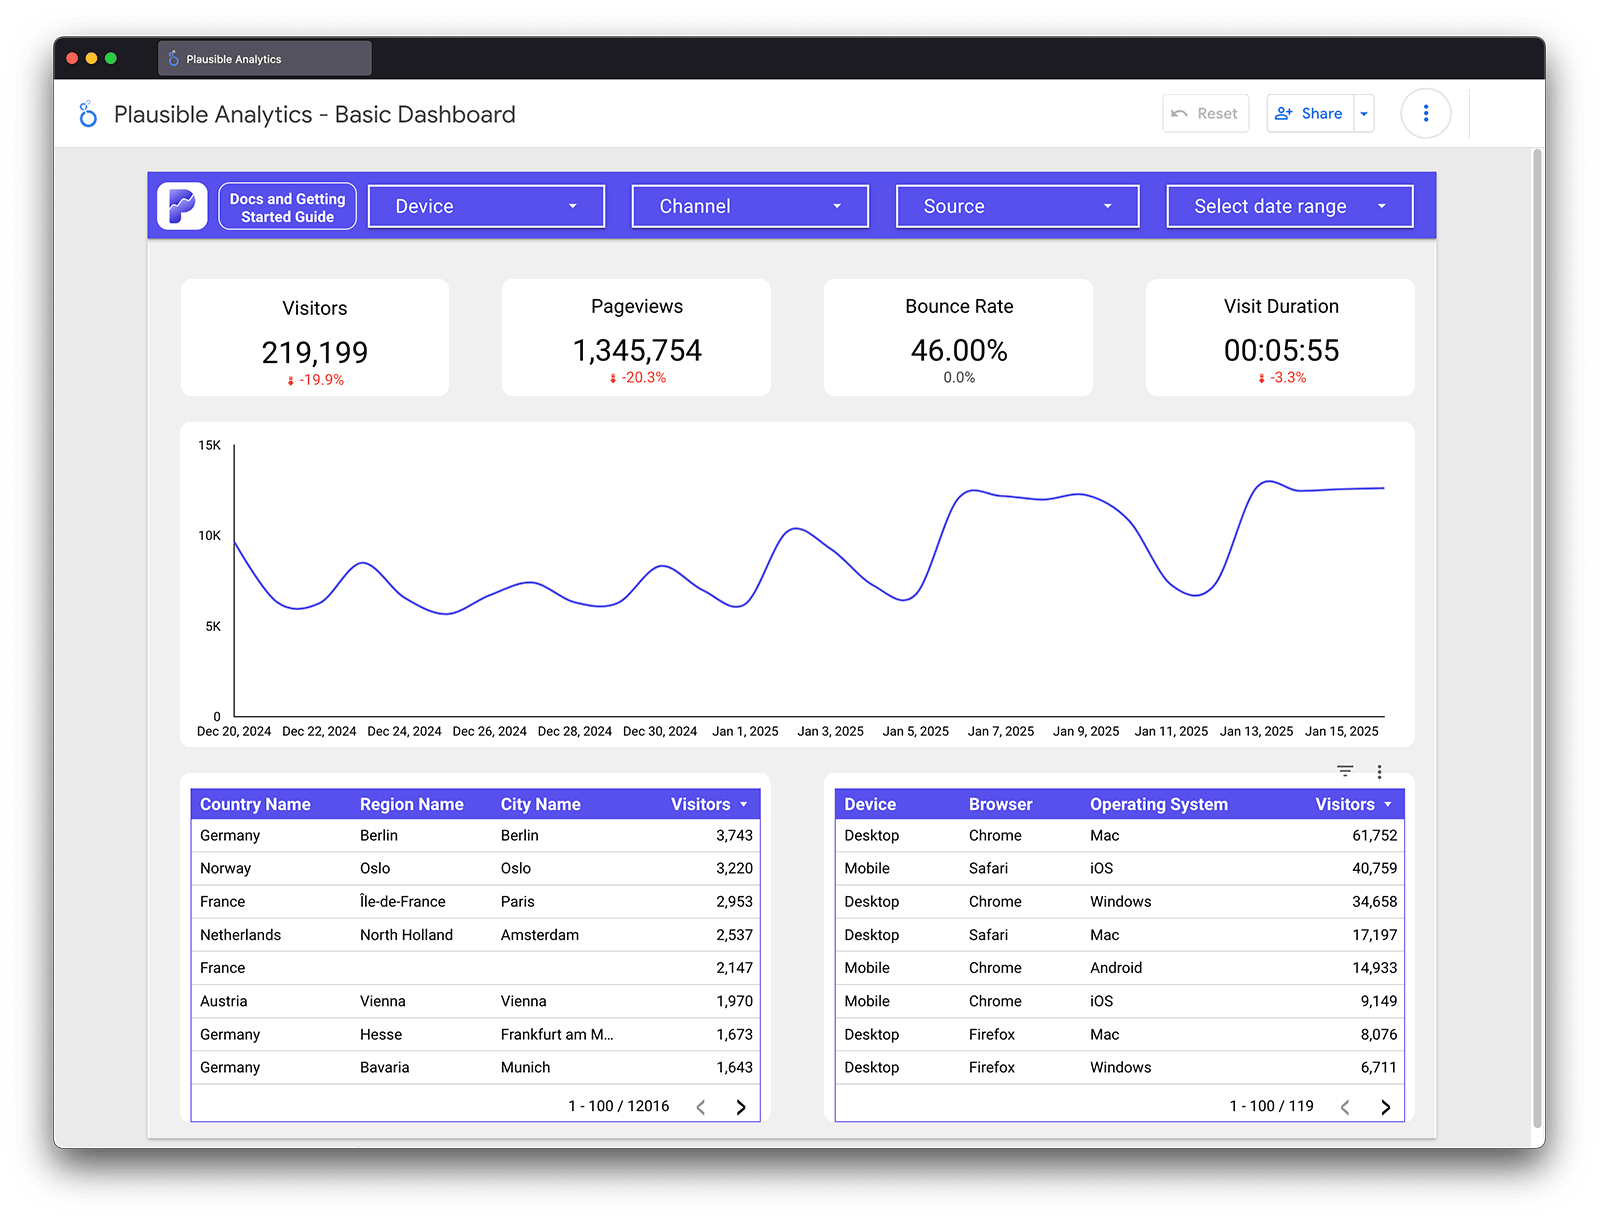
Go beyond the dashboard layout. The Plausible dashboard shows one view. Data Studio lets you build tables with multiple dimensions at once, stacked charts, conditional formatting, running totals and calculated fields. If you’ve ever wanted to see country, region and city in the same table without clicking through, that’s one example.
Automate reporting. Reports can pull updated data without being rebuilt. Choose real-time refresh or use the six-hour cache, then share a live link with your team.
What’s available in the connector
The connector includes the main fields used for traffic, acquisition, content, goals, custom properties and revenue reporting:
- Traffic metrics: visitors, visits, pageviews, bounce rate, visit duration
- Dimensions: page, source, channel, country, region, city, device, browser, OS, entry page, exit page
- Goal and custom event data: goal name, conversions, conversion rate
- Custom properties, exposed as the “Custom Prop” (property name) and “Custom Prop Value” fields
- Revenue metrics (if you have revenue goals set up)
- Real-time data refresh or 6-hour caching depending on your preference
Getting started
Setup takes a few minutes. You’ll need a Plausible Stats API key, which you can create in your account settings under API Keys.
See the full setup guide in our Data Studio documentation.
To get a feel for what’s possible, explore the templates we’ve built:
- Simple report template: a clean replica of the Plausible dashboard to use as a starting point
- Advanced report template: data blending, calculated metrics, conditional formatting and more
For a full walkthrough of Data Studio’s features using these templates as examples, see our Data Studio beginner’s guide.
Works alongside the other official integrations
The Data Studio connector works with data from any Plausible site, whether you installed Plausible via the WordPress plugin, the Google Tag Manager template or the direct script. It reads from the same data your Plausible dashboard shows.
If you manage multiple sites, the connector lets you pull data from several of them into a single Data Studio report.